The CMS overall star rating can be viewed on our PDP-Finder and MA-Finder tools as an "additional info" option. To learn more, you can click on the next two examples of how quality star ratings are integrated into our plan finders: PDP example: California Medicare Prescription Drug Plans. MA and MAPD example: Miami-Dade County, Florida Medicare Advantage Plans.
Overview of 2015 Star Ratings
The quality of Medicare Part D plans is showing an increasing trend. The average overall quality star rating for 2015 stand-alone Medicare Part D plans increased to 3.71 stars as compared to the 2014 average PDP star rating of 3.40. In addition, fewer 2015 Medicare Part D plans fell below a 3-star rating (9%) as compared to (16%) of the 2014 PDPs. However, in 2015, for the first time one Medicare Part D plan fell to a 1.5 star rating.
The average overall quality star rating decreased slightly for Medicare Advantage plans, falling to a rating of 3.64 stars as compared to the slightly higher 2014 average MA/MAPD star rating of 3.66. We also found that more 2015 Medicare Advantage plans fell below a 3-star rating (7%) as compared to (3.8%) of the MA/MAPDs that were below a 3-star rating in 2014. However, 2015 Medicare Advantage plans did not fall as low as the 2013 MA/MAPD level where (13%) of all Medicare Advantage plans fell under the 3.00 star rating.
How are the Star Ratings calculated?
The Centers for Medicare & Medicaid Services (CMS) uses information from member satisfaction surveys, plans, and health care providers to award performance star ratings to Medicare plans. These ratings are an incentive for Medicare plans to improve plan quality by making it easier for beneficiaries to compare and choose Medicare plans based on annual quality and performance measures.
In general, CMS rates stand-alone Medicare Part D plans (PDPs) and Medicare Advantage plans with prescription drug coverage (MAPDs) based on:
1. Medicare Part D Member safety and accuracy of drug pricing
2. Member experience with the PDP
3. Member complaints, problems getting services, and improvement in the drug plan’s performance
4. The Medicare Part D plan's customer service
Medicare Advantage plans (MAs and MAPDs) are rated on:
1. Plan Members staying healthy: screenings, tests, and vaccines
2. How well the plan manages chronic (long-‑term) conditions
3. Member experience with the MA or MAPD
4. Member complaints, problems getting services, and improvement in the health plan’s performance
5. The Medicare Advantage plan's customer service
More specifically, stand-alone Medicare Part D plans covering only prescription drug services (PDPs) receive a summary quality score for those services in 17 different topics within four categories. Medicare Advantage plans covering only health services (MAs) (Medicare Part A and Medicare Part B) receive a summary score for quality for those services in 36 different topics within five categories. Medicare Advantage plans covering both health and prescription drug services (MAPDs) receive a summary quality score for those services in 53 topics within nine categories.
As a note, the 2014 star rating data in the following section was collected in October, 2013 when the 2014 star ratings were initially released by CMS. At that point in time, many Medicare plans were not included by CMS in the data for various reasons, but primarily due to plan sanctions. You will notice that the charts in the latter section of this blog show more 2014 Medicare plans. This section used the final 2014 star rating data and therefore includes many additional Medicare plans. We decided to stay with the early 2014 data in the next section of this blog so that our analysis would stay consistent with our analysis from last year's comparison of 2013 and 2014 Medicare Part D plan ratings.
The 2015 stand-alone Medicare Part D Plan Star Ratings
As noted in the chart below, 2015 stand-alone Medicare Part D prescription drug plans (PDPs) have an overall slightly-higher-than-average star rating of 3.71 and the only 2014 5-Star stand-alone prescription drug plans was reduced to a 4.00 star rating in 2015. However, three new 2015 Medicare Part D plans have achieved a 5-star rating.
| 2015 Stand-Alone Prescription Drug Plans - Medicare Star Rating | |||||||||
| Star Rating | 1.5 | 2 | 2.5 | 3 | 3.5 | 4 | 4.5 | 5 | Total Plans* |
| PDPs with rating | 1 | 1 | 3 | 6 | 18 | 13 | 10 | 3 | 55 |
| % PDPs with rating | 2% | 2% | 5% | 11% | 33% | 24% | 18% | 5% | |
| PDPs with rating lower than 3.0 | 5 plans (9%) | |
Average rating for all rated PDP plans |
3.71 | |||||
In comparison, the 2014 stand-alone Medicare Part D prescription drug plans (PDPs) had an average star rating of 3.40. There was only one 5-Star stand-alone 2014 PDP and this PDP was only available to residents of New York.
| 2014 Stand-Alone Prescription Drug Plans - Medicare Star Rating | ||||||||
| Star Rating | 2 | 2.5 | 3 | 3.5 | 4 | 4.5 | 5 | Total Plans* |
| PDPs with rating | 0 | 9 | 14 | 16 | 12 | 3 | 1 | 55 |
| % PDPs with rating | 0% | 16% | 25% | 29% | 22% | 5% | 2% | |
| PDPs with rating lower than 3.0 | 9 plans (16%) | Average rating for all rated PDP plans | 3.40 | |||||
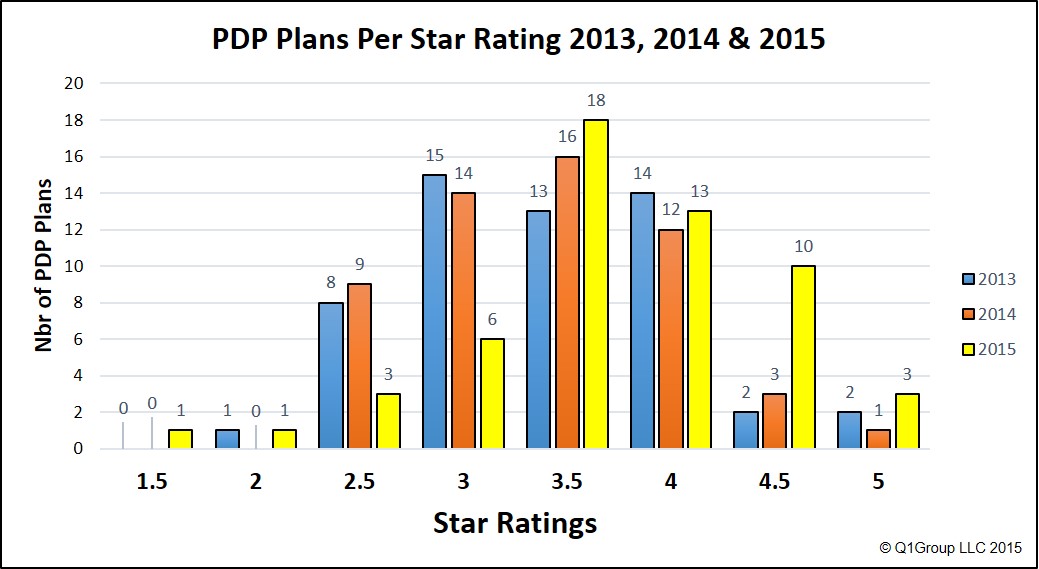
Comparing 2013, 2014, and 2015 Medicare Part D Star Ratings
As can be seen in the following graph, the 2015 overall star ratings for stand-alone PDPs are trending toward the higher star levels.
The 2015 Medicare Advantage Plan Star Ratings
The 2015 Medicare Advantage plans have an overall quality star rating of 3.64 as compared to the 2014 overall star rating of 3.66 and the 2013 overall star rating of 3.46. As in 2014, a majority of 2015 Medicare Advantage plans have a rating of 3-stars or more. However, the percentage of plans with 3-stars or higher was less than in 2014. Slightly more 2015 Medicare Advantage plans (3%) achieved a 5-star (excellent) rating as compared to 2% of Medicare Advantage plans in 2014.
| 2015 Medicare Advantage Plans - Medicare Star Rating | |||||||||
| Star Rating | 1.5 | 2 | 2.5 | 3 | 3.5 | 4 | 4.5 | 5 | Total Plans* |
| Med. Adv. Plans** with rating | 0 | 2 | 26 | 73 | 136 | 86 | 61 | 11 | 395 |
| % MAs** with rating | 0% | 1% | 7% | 18% | 34% | 22% | 15% | 3% | |
| Med. Adv. Plans** with rating lower than 3.0 | 28 plans (7%) |
Average rating for all rated Medicare Advantage Plans** |
3.64 | ||||||
As a note, 10 Medicare Advantage plans available for 2014 that earned a 5-Star rating and they were available in 133 counties across the country -- these counties are in CA, CO, DC, FL, HI, IA, MD, NY, OR, TX, VA, WA, WI. (To see if 5-star rated Medicare Advantage plans are available in your area, go to MA-Finder.com, enter your ZIP Code and click the 5-star rated plans box. Ex: Bay County, FL).
| 2014 Medicare Advantage Plans - Medicare Star Rating | |||||||||
| Star Rating | 2 | 2.5 | 3 | 3.5 | 4 | 4.5 | 5 | Total Plans* | |
| Med. Adv. plans** with rating | 1 | 15 | 102 | 147 | 80 | 65 | 10 | 420 | |
| % MAs** with rating | 0.2% | 4% | 24% | 35% | 19% | 15% | 2% | ||
| Med. Adv. plans** with rating lower than 3.0 | 16 plans (3.8%) |
Average rating for all rated Medicare Advantage plans** |
3.66 | ||||||
*Medicare uses the term plan(s) to mean the contract identifier associated with the plan. In the chart above the total plans is the total number of unique contract id (ex: H1234 or S1234).
**Medicare Advantage plans include all types (Cost, PFFS, HMO, PPO, regional and local). If the same contract was offered with and without prescription drug coverage, it was only counted once.
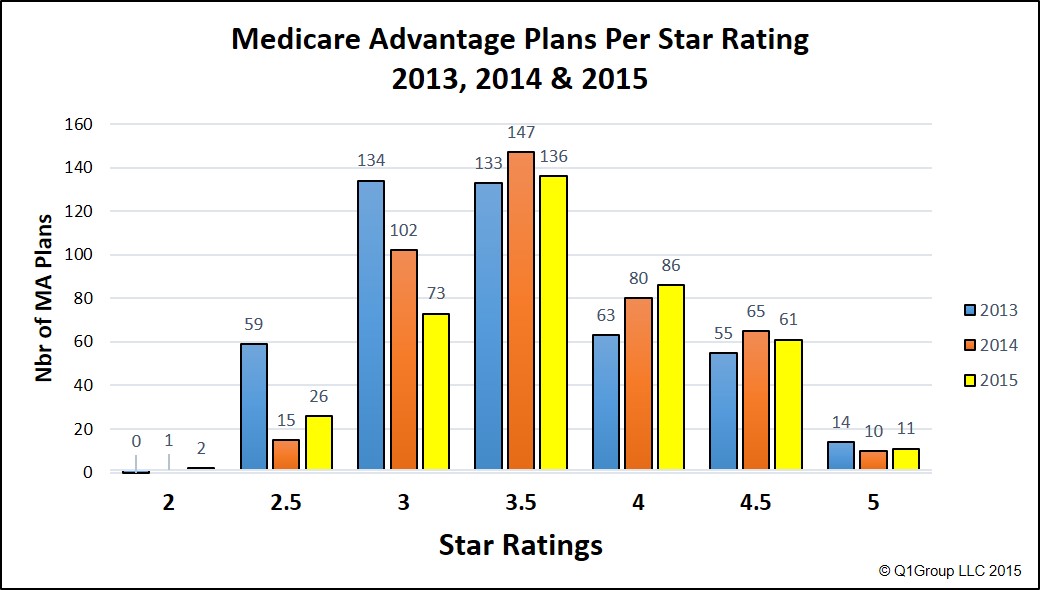
Comparing 2013, 2014, and 2015 Medicare Advantage Star Ratings
As can be seen in the following graph, the 2015 and 2014 overall star ratings for MAs and MAPDs are stabilizing as compared to 2013 ratings with a slight trend in the last two years toward the higher star levels.
The star ratings are increasingly important as Medicare entices plans to increase plan quality by having the special enrollment period for 5-star plans introduced in the 2012 plan year and the special enrollment period for consistently low-performing plans that was introduced in the 2013 plan year.
The single summary quality star rating also provides Medicare beneficiaries with an easier means to compare plans based on quality and performance.
Rising and Falling Stars: How 2014 plans changed in 2015
The following chart shows the changing trend for the plan star ratings from 2014 to 2015 and how many plans increased or decreased their star rating - or are no longer available. For example, there were a total of 14 plans in 2014 with a 3-star rating. Of those 2014 3-star Medicare Part D plans, two Medicare Part D plans are no longer offered in 2015, and only one 3-star 2014 Medicare Part D plan star rating remained unchanged from 2014 to 2015 (7%). However, ten (10) Medicare Part D plans increased their 3- star rating (71%) and one 3-star plan dropped in plan rating (7%).
Most importantly, you can see from the chart below, that a large percentage of stand-alone Medicare Part D plans from the lower or average star-rating categories saw an improvement in their quality ratings from 2014 to 2015.
| Change in 2014 Stand-Alone Prescription Drug Plan Ratings for 2015 | ||||||||||
| Total Nbr Plans (Contract IDs) | Plans no longer Available | Plans with a Star Rating Decrease | Plans whose Star Rating Stayed the same | Plans with a Star Rating Increase | ||||||
| Stars | Plans | % | Plans | % | Plans | % | Plans | % | ||
| 2014 PDP Plan Rating | 2 | 0 | 0 | - | 0 | - | 0 | - | 0 | - |
| 2.5 | 10 | 7 | 70% | 0 | - | 0 | - | 3 | 30% | |
| 3 | 14 | 2 | 14% | 1 | 7% | 1 | 7% | 10 | 71% | |
| 3.5 | 18 | 6 | 33% | 4 | 22% | 4 | 22% | 4 | 22% | |
| 4 | 13 | 3 | 23% | 3 | 23% | 4 | 31% | 3 | 23% | |
| 4.5 | 3 | 0 | - | 0 | - | 2 | 67% | 1 | 33% | |
| 5 | 2 | 1 | 50% | 1 | 50% | 0 | - | 0 | - | |
| Totals 2014 Plans: | 60 | 19 | 32% | 9 | 15% | 11 | 18% | 21 | 35% | |
Medicare Advantage plans showed a slight tendency toward improvement in star rating from 2014 to 2015. As with PDPs, the 2014 lower-rated Medicare Advantage plans had a tendency toward increasing their star rating as compared to the moderately rated plan. Perhaps, more important is the large number (36%) of 2014 Medicare Advantage plans that are no longer being offered in 2015.
| Change in 2014 Medicare Advantage Plan Ratings for 2015 | ||||||||||
| Total Nbr Plans (Contract IDs) | Plans no longer Available | Plans with a Star Rating Decrease | Plans whose Star Rating Stayed the Same | Plans with a Star Rating Increase | ||||||
| Stars | Plans | % | Plans | % | Plans | % | Plans | % | ||
| 2014 Med. Adv. Plan Ratings | 2 | 1 | 1 | 100% | 0 | - | 0 | - | 0 | - |
| 2.5 | 17 | 9 | 53% | 0 | - | 3 | 18% | 5 | 29% | |
| 3 | 126 | 50 | 40% | 10 | 8% | 42 | 33% | 24 | 19% | |
| 3.5 | 196 | 82 | 42% | 19 | 10% | 73 | 37% | 22 | 11% | |
| 4 | 104 | 29 | 28% | 23 | 22% | 40 | 38% | 12 | 12% | |
| 4.5 | 91 | 27 | 30% | 19 | 21% | 40 | 44% | 5 | 5% | |
| 5 | 11 | 1 | 9% | 3 | 27% | 7 | 64% | - | - | |
| Totals 2014 Plans: | 546 | 199 | 36% | 74 | 14% | 205 | 38% | 68 | 12% | |
- No enrollment fee and no limits on usage
- Everyone in your household can use the same card, including your pets
- Sign-up for our Medicare Part D Newsletter.
- PDP-Facts: 2024 Medicare Part D plan Facts & Figures
- 2024 PDP-Finder: Medicare Part D (Drug Only) Plan Finder
- PDP-Compare: 2023/2024 Medicare Part D plan changes
- 2024 MA-Finder: Medicare Advantage Plan Finder
- MA plan changes 2023 to 2024
- Drug Finder: 2024 Medicare Part D drug search
- Formulary Browser: View any 2024 Medicare plan's drug list
- 2024 Browse Drugs By Letter
- Guide to 2023/2024 Mailings from CMS, Social Security and Plans
- Out-of-Pocket Cost Calculator
- Q1Medicare FAQs: Most Read and Newest Questions & Answers
- Q1Medicare News: Latest Articles
- 2025 Medicare Part D Reminder Service