Q1Group 2016 MA/MAPD Analysis Summary: Overall more 2016 Medicare Advantage plan choices - Medicare Advantage landscape changes 2013 to 2016
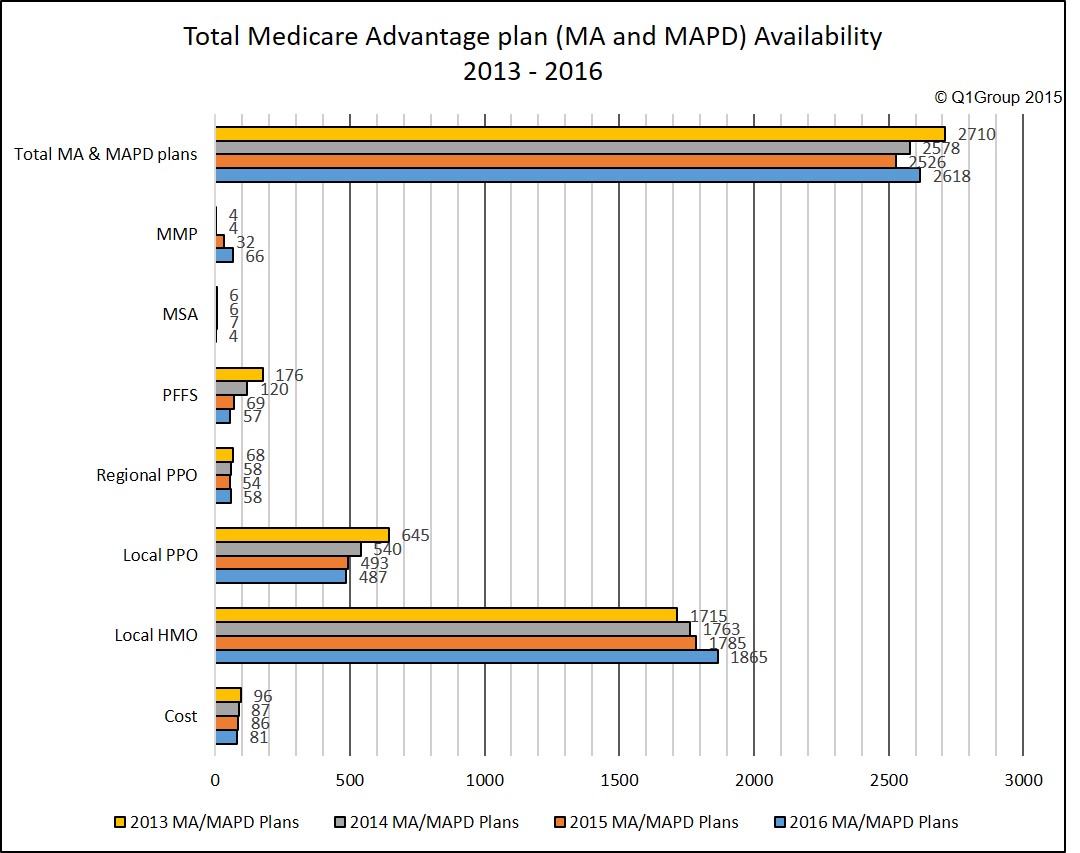
The total number of 2016 Medicare Advantage plans will increase slightly across the country with 4% more Medicare Advantage plans offered in 2016. Overall, there will be 2,618 Medicare Advantage plans (MAs and MAPDs) available in 2016, as compared to 2,526 Medicare Advantage plans offered in 2015.
Most (90%) of 2016 Medicare Advantage plans will include prescription drug coverage (MAPDs). In fact, more 2016 Medicare Advantage plans available will include prescription drug coverage (MAPD) as compared to 2015. However, slightly fewer 2016 Medicare Advantage plans without prescription coverage (MA) will be offered in 2016, as compared to in 2015.
The majority (around 71%) of 2016 Medicare Advantage plans will be HMOs (Health Maintenance Organizations), 20% of 2016 Medicare Advantage plans will be Local PPOs (Preferred Provider Organizations). Medicare Advantage HMOs also show the greatest increase in the total number of 2016 plans (with the addition of 80 HMO plans).
*Note: this is number of MMP plans in the September, 2013 landscape file
Reminder: Types of Medicare Advantage Plans
As you browse through the 2016 Medicare Advantage plans, you will see in our Medicare Advantage search tools that there are seven common types of Medicare Advantage plans offered.
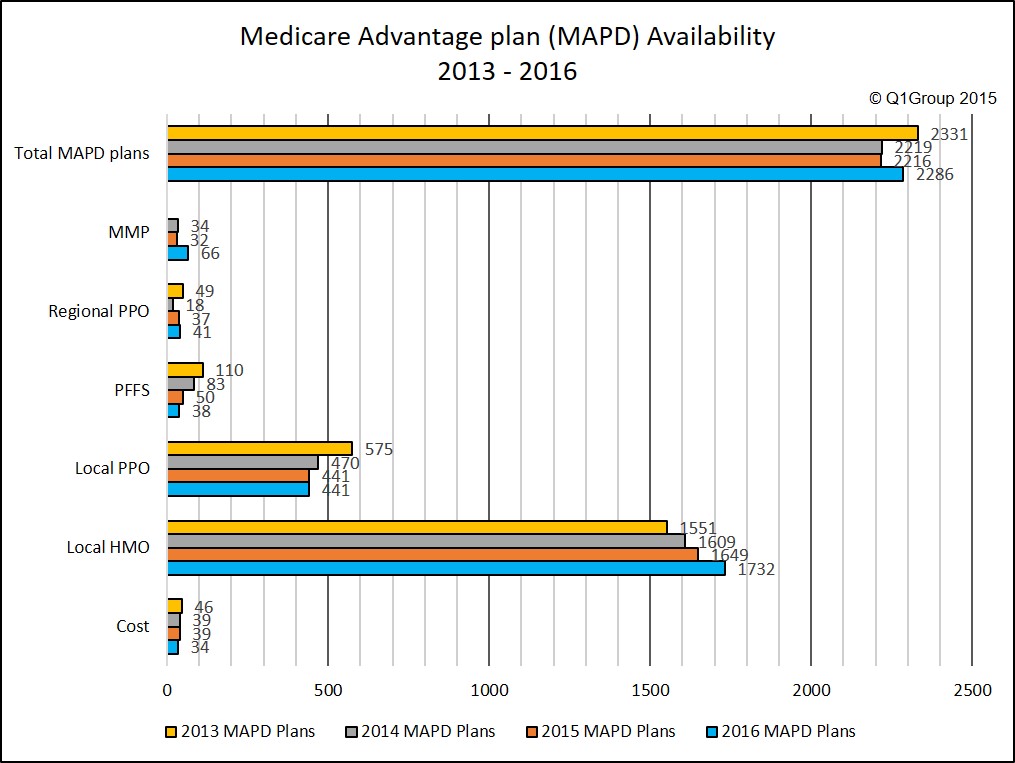
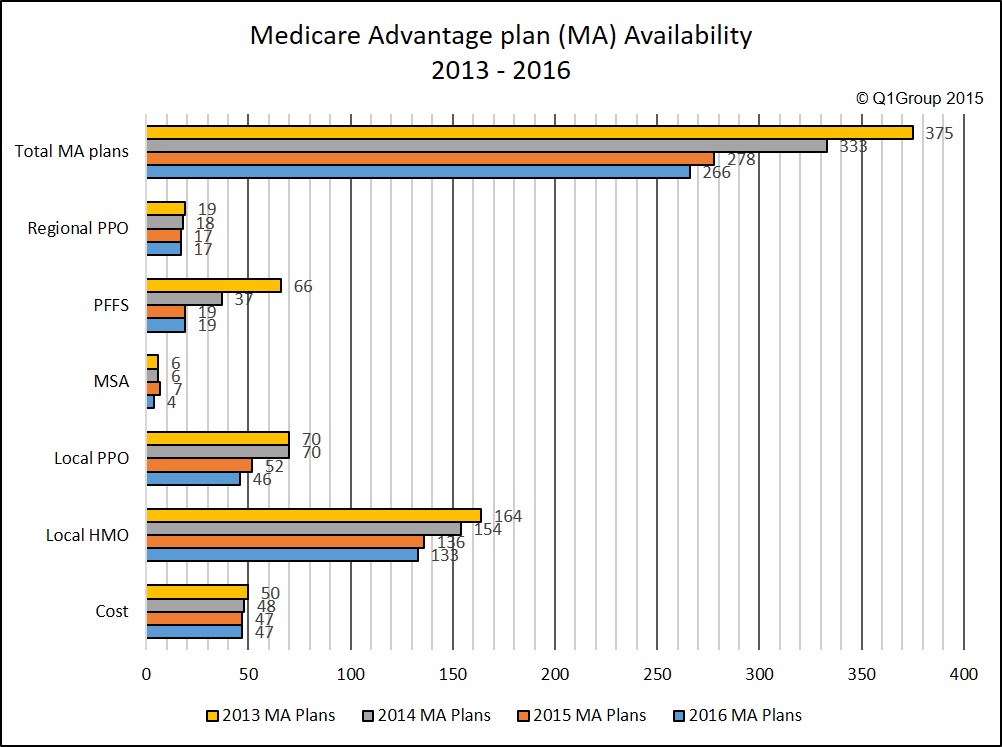
As compared to the 2,286 MAPDs or Medicare Advantage plans that provide prescription drug coverage in 2016, there are only 266 different 2016 MAs or Medicare Advantage plans that offer health coverage only (no prescription drug coverage). And across the country, there will be 12 fewer MA plans in 2016.
Other resources
2016 Medicare Advantage plan information is available in our 2016 Medicare Advantage plan finder (or MA-Finder) that can be found at: MA-Finder.com/2016.
You can also see how each 2015 Medicare Advantage plan is changing in 2016 using our Medicare Advantage comparison tool found at: MA-Compare.com/2016.
Most (90%) of 2016 Medicare Advantage plans will include prescription drug coverage (MAPDs). In fact, more 2016 Medicare Advantage plans available will include prescription drug coverage (MAPD) as compared to 2015. However, slightly fewer 2016 Medicare Advantage plans without prescription coverage (MA) will be offered in 2016, as compared to in 2015.
The majority (around 71%) of 2016 Medicare Advantage plans will be HMOs (Health Maintenance Organizations), 20% of 2016 Medicare Advantage plans will be Local PPOs (Preferred Provider Organizations). Medicare Advantage HMOs also show the greatest increase in the total number of 2016 plans (with the addition of 80 HMO plans).
The number of Private Fee for Service (PFFS) Medicare Advantage plans continues to decline in 2016 (a 17% decrease in PFFS plans). In 2015, the number of PFFS Medicare Advantage plans decreased by 43% (with PFFS Medicare Advantage plans offering prescription drug coverage decreasing by 66% or losing 33 PFFS MAPD plans in 2015).
Jump to MAPD Plan chart
Jump to MA Plan chart
Jump to Health Plan Type definitions
| Change in the Number of All Medicare Advantage Plans (MA & MA-PD) |
|||||
| Number of Medicare Advantage Plans (MA & MA-PD) | |||||
| Health Plan Type | 2016 | 2015 | Change ’15 to ‘16 | 2014 | |
| Cost | 81 | 86 | -5 | -6% | 87 |
| Local HMO | 1,865 | 1,785 | 80 | 4% | 1,763 |
| Local PPO | 487 | 493 | -6 | -1% | 540 |
| Regional PPO | 58 | 54 | 4 | 7% | 58 |
| All PPOs | 545 | 547 | -2 | 0% | 598 |
| PFFS | 57 | 69 | -12 | -17% | 120 |
| MSA | 4 | 7 | -3 | -43% | 6 |
| MMP | 66 | 32 | 34 | 106% | 4* |
| Total MA & MAPD plans | 2,618 | 2,526 | 92 | 4% | 2,578 |
*Note: this is number of MMP plans in the September, 2013 landscape file
Reminder: Types of Medicare Advantage Plans
As you browse through the 2016 Medicare Advantage plans, you will see in our Medicare Advantage search tools that there are seven common types of Medicare Advantage plans offered.
- HMO - Health Maintenance Organizations: HMOs are wellness based Medicare Advantage plans and usually have the most-restrictive healthcare provider network, meaning that your healthcare costs may be considerably higher if you go outside of your plan’s established network. Also, depending on your HMO plan, you may only be allowed outside of your plan network with a referral from your doctor. Local HMOs are often very affordable compared to other Medicare Advantage plans because the restrictive network and focus on wellness helps to control healthcare costs. The majority of 2016 Medicare Advantage plans will be HMOs (Health Maintenance Organizations).
- HMO POS - Health Maintenance Organizations Point-of-Service: These Medicare Advantage HMO’s have a more flexible healthcare network allowing you to seek care outside of your plan’s network by paying a higher cost-sharing rate. This type of HMO is chosen often for people who travel part of the year, but still return home for the majority of their healthcare needs. For instance, you may have a $30 co-payment when you visit a healthcare provider in-network (at home) and pay $60 when you visit a provider outside of the plan’s network (while traveling). Important: Some 2015 HMO POS plans will convert to HMOs (without the POS option) in 2016. Please note, depending on your HMO POS, you may find that out-of-network costs do not apply to your plan's that your Maximum Out of Pocket (MOOP) limit - check with your plan's Member Services for more details.
- PPO - Preferred Provider Organization: Medicare Advantage PPOs have a less-restrictive provider network, but again, you probably will pay a higher cost-sharing rate when you visit a healthcare provider outside of your plan’s network.
- PFFS - Private Fee for Service plans: Although popular several years ago, fewer Medicare Advantage PFFS plans are now available (only 57 PFFS plans are available in 2016). PFFS plans have the most flexible network, meaning that you can go to any health care provider as long as they accept Medicare and the terms and conditions of your PFFS plan. As noted, in 2016, PFFS plans will become rare, but some people still find PFFS plans as a flexible and economic alternative to other Medicare Advantage plans.
- SNPs - Special Needs Plans: SNPs are Medicare Advantage plans designed for a people with specific conditions or financial needs. Certain SNPs are available only to diabetics, people with chronic cardiac conditions, nursing home residents, or people eligible for both Medicare and Medicaid (D-SNPs). If you do not have the plan’s “special need”, you will not be allowed to join one of these plans.
- MSAs - Medical Savings Accounts: MSAs are like Health Savings Accounts (or HSAs) or a high-deductible health plan combined with a spending account that you can use to pay for your health care costs. MSAs do not provide prescription drug coverage and you would need to join a separate Medicare Part D plan for your prescription needs. Unfortunately, few MSAs are available.
- MMPs - Medicare-Medicaid Plans: MMP plans were introduced in 2014 and are only offered in a few locations across the country. As noted by CMS: "A Medicare-Medicaid Plan (MMP) [like a D-SNP] is a private health plan that has been competitively selected and approved to provide integrated care to eligible full-benefit Medicare-Medicaid enrollees under the CMS Financial Alignment Demonstration." (CMS, “Financial Alignment Initiative,”
(www.cms.gov/Medicare-Medicaid-Coordination/Medicare-and-Medicaid-Coordination/Medicare-Medicaid-Coordination-Office/FinancialModelstoSupportStatesEffortsinCareCoordination.html.)
MMPs only serve full benefit dual (Medicare/Medicaid) eligible beneficiaries and some additional limitations may apply.
| Change in the Number of MA-PD Plans | |||||
| Number of Medicare Advantage Plans With Drug Coverage | |||||
| Health Plan Type | 2016 | 2015 | Change ’15 to ‘16 |
2014 | Change ’14 to ‘15 |
| Cost | 34 | 39 | -5 | 39 | 0 |
| Local HMO | 1,732 | 1,649 | 83 | 1,609 | 40 |
| Local PPO | 441 | 441 | 0 | 470 | -29 |
| PFFS | 38 | 50 | -12 | 83 | -33 |
| Regional PPO | 41 | 37 | 4 | 18 | -1 |
| MMP | 66 | 32 | 34 | 34 | -2 |
| Total MAPD Plans | 2,286 | 2,216 | 70 | 2,219 | -3 |
As compared to the 2,286 MAPDs or Medicare Advantage plans that provide prescription drug coverage in 2016, there are only 266 different 2016 MAs or Medicare Advantage plans that offer health coverage only (no prescription drug coverage). And across the country, there will be 12 fewer MA plans in 2016.
| Change in the Number of Medicare Advantage Plans Without Drug Coverage |
|||||
| Number of Plans |
|||||
| Health Plan Type | 2016 | 2015 | Change ’15 to ‘16 |
2014 | Change ’14 to ‘15 |
| Cost | 47 | 47 | 0 | 48 | -1 |
| Local HMO | 133 | 136 | -3 | 154 | -18 |
| Local PPO | 46 | 52 | -6 | 70 | -18 |
| MSA | 4 | 7 | -3 | 6 | 1 |
| PFFS | 19 | 19 | 0 | 37 | -1 |
| Regional PPO | 17 | 17 | 0 | 18 | -1 |
| Total MA Plans w/o Rx Cov. | 266 | 278 | -12 | 333 | -55 |
Other resources
2016 Medicare Advantage plan information is available in our 2016 Medicare Advantage plan finder (or MA-Finder) that can be found at: MA-Finder.com/2016.
You can also see how each 2015 Medicare Advantage plan is changing in 2016 using our Medicare Advantage comparison tool found at: MA-Compare.com/2016.
News Categories
Q1 Quick Links
- Sign-up for our Medicare Part D Newsletter.
- PDP-Facts: 2024 Medicare Part D plan Facts & Figures
- 2024 PDP-Finder: Medicare Part D (Drug Only) Plan Finder
- PDP-Compare: 2023/2024 Medicare Part D plan changes
- 2024 MA-Finder: Medicare Advantage Plan Finder
- MA plan changes 2023 to 2024
- Drug Finder: 2024 Medicare Part D drug search
- Formulary Browser: View any 2024 Medicare plan's drug list
- 2024 Browse Drugs By Letter
- Guide to 2023/2024 Mailings from CMS, Social Security and Plans
- Out-of-Pocket Cost Calculator
- Q1Medicare FAQs: Most Read and Newest Questions & Answers
- Q1Medicare News: Latest Articles
- 2025 Medicare Part D Reminder Service