More 2019 Medicare Advantage Special Needs Plan (SNP) options - with significant changes in the 2019 SNP landscape
Updated October 14, 2019 with CMS revised landscape data.
In general, as compared to past years, there will be an increase in the total number of 2019 Medicare Advantage Special Needs Plans (SNPs) — with SNP losses in some service areas offset by SNP gains in other areas. However, the net gain of 2019 SNPs does not highlight the significant overall changes in the 2019 SNP landscape.
First, the good news ...
We will have a number of new Medicare Advantage SNPs introduced in 2019 and with these newly released plans, we will actually see an 13.8% increase in the total nationwide 2019 SNP landscape.
But, 21% of all 2018 Special Needs Plans (SNPs) are discontinued for 2019
Based on our analysis, about 21% of the 2018 Medicare Advantage Special Needs Plans (SNPs) will be discontinued in 2019 — as compared to around 17% of the 2017 Special Needs Plans that were discontinued in 2018.
As background, a brief review of Medicare Advantage Special Needs Plans
Special Needs Plans are a type of Medicare Advantage plan with plan benefits, healthcare provider choices, and drug formularies (list of covered drugs) designed to accommodate the needs of a particular group of people meeting certain requirements - such as people suffering from a chronic condition or illness or who have limited financial resources.
A Medicare Advantage SNP is not designed for everyone.
Please remember that you cannot join (or remain in) a Medicare Advantage SNP unless you qualify for the plan’s “Special Need” - that is, SNPs are designed for people with specific conditions, diseases, or characteristics -- and you must meet (and continue to meet) the plan's "Special Need" to be eligible for enrollment.
SNPs are divided into three major types of special needs:
- Chronic Illness SNPs (like diabetes, heart disease, or ESRD),
- Dual Eligible D-SNPs (for Medicare and Medicaid beneficiaries), and
- Institutional SNPs (for Nursing and Long Term Care (LTC) residents).
| 2019 Special Needs Plans by Type of Special Need |
||||||||
| SNP Type | 2019 Plans | 2018 Plans | Net Change* | % Net Change | Dropped Plans* | % of '18 SNPs Dropped | 2017 Plans | 2016 Plans |
| Chronic Illness | 127 | 132 | -5 | -4% | 28 | 21% | 122 | 139 |
| Dual Eligible | 465 | 401 | 64 | 16% | 75 | 19% | 371 | 342 |
| Institutional | 125 | 97 | 28 | 29% | 32 | 33% | 87 | 69 |
| Total | 717 | 630 | 87 | 14% | 135 | 21% | 580 | 550 |
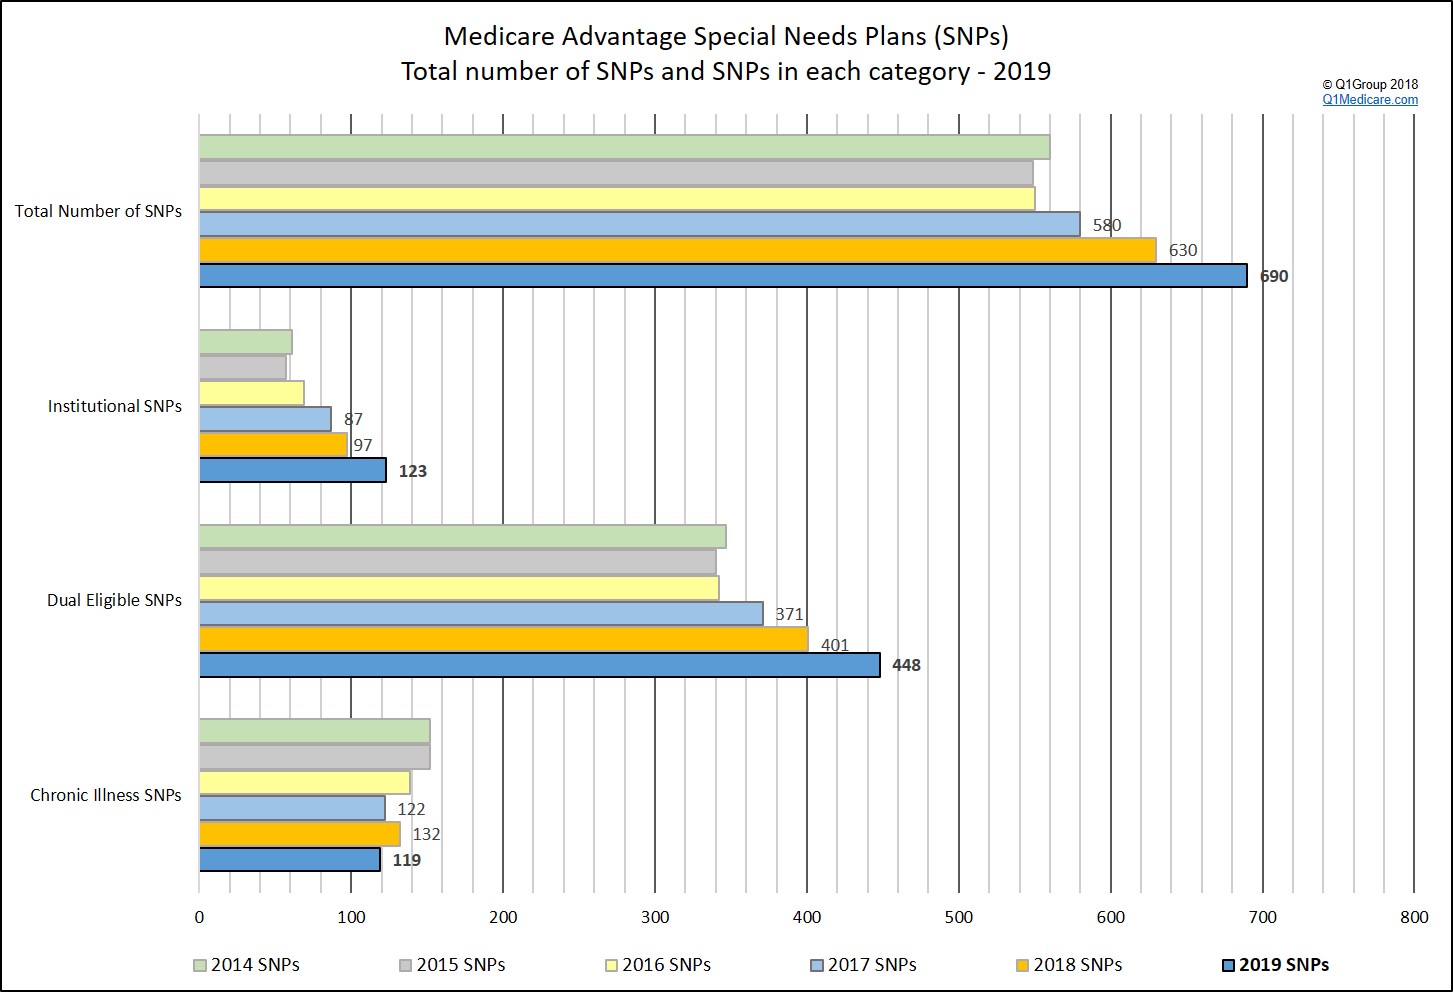
The chart below summarizes the 2019 Special Needs Plan landscape and how the SNP landscape has changed over the years.
You can learn more about the 2019 SNPs available in your area by using our Medicare Advantage plan finder (MA-Finder.com/2019) or add your ZIP code to the MA-Finder.com link to see plans in your area (MA-Finder.com/2019/90001).
And here is an example of all 2019 Special Needs Plans available in Allegheny County, PA.
Please note, if you are using our MA-Finder and looking for a Dual-Eligible Medicare/Medicaid SNP (D-SNP), be sure to indicate "100%" for the "LIS Subsidy Amount" to see the actual D-SNP monthly premiums for full-dual eligible Medicare/Medicaid beneficiaries.
Where are the most SNPs?
As in past years, the most Special Needs Plans are available within a few counties located in New York, Florida, and California.
| Counties with the Largest Number of 2019 Special Needs Plans |
||||||||
| Locations | SNPs | |||||||
| Kings County, NY | 40 | |||||||
| Queens County, NY | 39 | |||||||
| Miami-Dade County, FL | 39 | |||||||
| New York County, NY | 38 | |||||||
| Bronx County, NY | 37 | |||||||
| Hillsborough County, FL | 34 | |||||||
| Pinellas County, FL | 33 | |||||||
| Nassau County, NY | 33 | |||||||
| Broward County, FL | 32 | |||||||
| Richmond County, NY | 32 | |||||||
A further note on Chronic Illness SNPs
Medicare Advantage Chronic Illness Special Needs Plans can be further divided into the type of chronic illness that the plan is designed to address.
| 2019 Special Needs – Chronic Illness Plans Compared to the 2018 Plan Year |
|||||
| Chronic Illness | Number of SNPs | ||||
| 2019 Plans | 2018 Plans | Change | 2017 Plans | 2016 Plans | |
| Cardiovascular Disorders | 0 | 1 | -1 | 1 | 1 |
| Cardiovascular Disorders & Chronic Heart Failure | 6 | 10 | -4 | 10 | 14 |
| Cardiovascular Disorders and Diabetes | 4 | 0 | 4 | 0 | 0 |
| Cardiovascular Disorders, Chronic Heart Failure & Diabetes | 45 | 45 | 0 | 40 | 49 |
| Chronic and Disabling Mental Health Conditions | 6 | 2 | 4 | 2 | 2 |
| Cardiovascular Disorders, Chronic Heart Failure, Diabetes Mellitus | 2 | 2 | 0 | 2 | 2 |
| Chronic Heart Failure | 1 | 0 | 1 | 2 | 2 |
| Chronic Heart Failure & Diabetes | 5 | 6 | -1 | 6 | 7 |
| Chronic Lung Disorders | 12 | 14 | -2 | 13 | 13 |
| Dementia | 6 | 6 | 0 | 2 | 2 |
| Diabetes Mellitus | 27 | 28 | -1 | 27 | 34 |
| End-stage Renal Disease Requiring Dialysis (any mode of dialysis) | 8 | 15 | -7 | 15 | 10 |
| End-stage Renal Disease Requiring Dialysis or HIV/AIDS | 2 | 0 | 2 | 0 | 0 |
| HIV/AIDS | 3 | 3 | 0 | 2 | 3 |
| Total Chronic Illness SNPs | 127 | 132 | -5 | 122 | 139 |
Changes with the SNP landscape
When comparing SNP reach (SNP plan multiplied by counties in the plan’s service area) we see an overall increase in plan reach. There is a notable increase in both dual eligible and institutional SNPs and, in 2019, once again a small increase in the number of chronic illness SNPs.
| 2019 Special Needs Plan Reach by Type of Need |
|||||||
| SNP Type | 2019 | 2018 | Change '18 to '19 |
Percent Change '18 to '19 |
2017 | 2016 | 2013 |
| Chronic Illness | 2,131 | 2,113 | 18 | 1% | 2,108 | 2,551 | 6,402 |
| Dual Eligible | 9,393 | 7,990 | 1,403 | 18% | 6,364 | 5,594 | 5,284 |
| Institutional | 1,503 | 1,165 | 338 | 29% | 732 | 556 | 537 |
| Total | 13,027 | 11,268 | 1,759 | 16% | 9,204 | 8,701 | 12,223 |
You can use our MA-Finder to review all 2019 Medicare Advantage Special Needs Plans available in your area (just enter your ZIP code after clicking on the link or go to MA-Finder.com to start.)
News Categories
Q1 Quick Links
- Sign-up for our Medicare Part D Newsletter.
- PDP-Facts: 2024 Medicare Part D plan Facts & Figures
- 2024 PDP-Finder: Medicare Part D (Drug Only) Plan Finder
- PDP-Compare: 2023/2024 Medicare Part D plan changes
- 2024 MA-Finder: Medicare Advantage Plan Finder
- MA plan changes 2023 to 2024
- Drug Finder: 2024 Medicare Part D drug search
- Formulary Browser: View any 2024 Medicare plan's drug list
- 2024 Browse Drugs By Letter
- Guide to 2023/2024 Mailings from CMS, Social Security and Plans
- Out-of-Pocket Cost Calculator
- Q1Medicare FAQs: Most Read and Newest Questions & Answers
- Q1Medicare News: Latest Articles
- 2025 Medicare Part D Reminder Service